Memory Heap Utilization
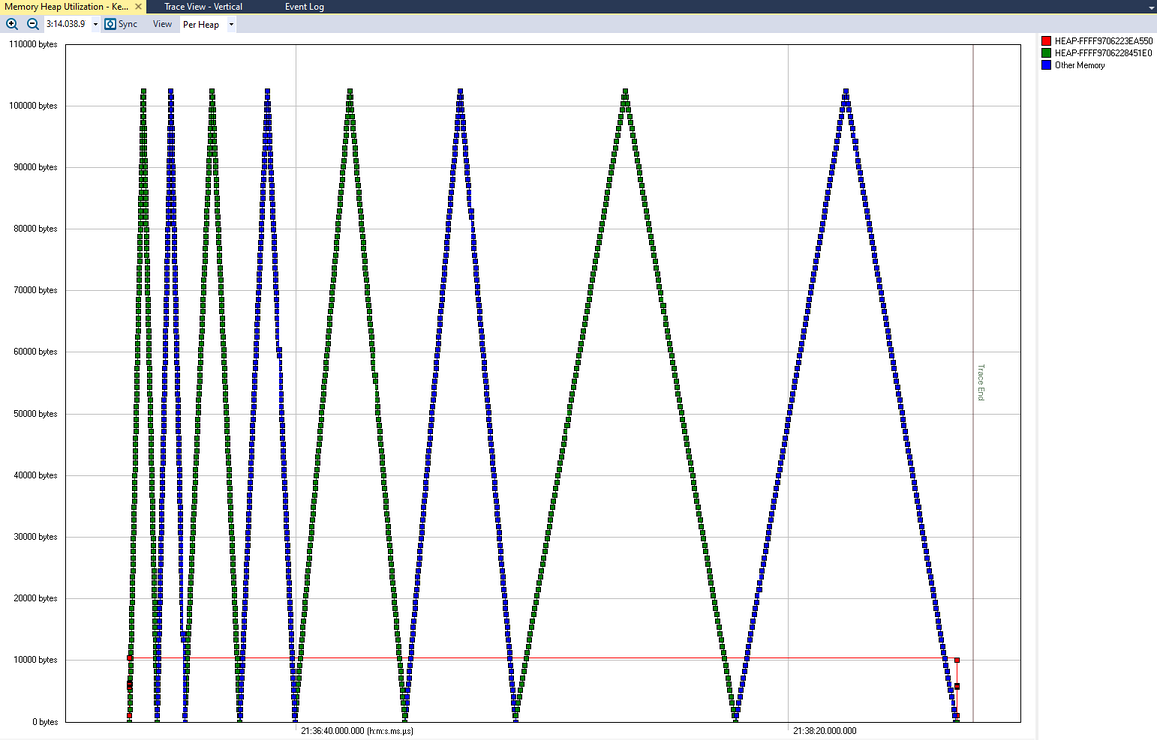
The Memory Heap Utilization view (Views > Memory Heap Utilization) displays the dynamic memory utilization over time. Each data point corresponds to a dynamic memory operation such as HeapAlloc,
This view displays a separate line for each memory heap, including a line labeled Other Memory, which represents allocation and free events by RtAllocateLocalMemory and RtFreeLocalMemory.
NOTE: This view does not show
View Options
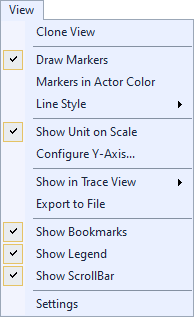
The View menu contains several options that allow you to change the graph’s display and content.
| Option | Description |
|---|---|
| Clone View |
Creates a duplicate copy of the view in the same window. |
| Draw Markers |
Toggles display of markers. |
|
Markers in Actor Color |
Sets all markers to the actor color if Draw Markers is selected. |
| Line Style |
Choose a line style for the graph to display:
|
| Show Unit on Scale |
Toggles display of the units of measurement. |
| Configure Y-Axis... | Opens the Configure Y-Axis dialog, through which you can choose an automatic (default) or manual setup. |
| Show in Trace View |
Show this data in the current Trace View or create a new Trace View to show the data. |
| Export to File | Opens the Export Graph dialog, through which you can export the graph data to a CSV file. |
| Setup Scale |
Opens the Setup Scale dialog, through which you can choose an automatic (default) or manual scale. |
| Show Bookmarks |
Toggles display of bookmarks |
| Show Legend |
Toggles display of the color legend. |
| Show ScrollBar |
Toggles display of the scroll bar. |
| Settings | Opens the View Settings dialog, through which you can set current and default settings for this view. |
Related Topics ABOUT TRACEALYZER:
- About Tracealyzer
- Terminology
- Understanding the Tracealyzer User Interface
- Configuring Tracealyzer
- Tips, Tricks, and Notes
rELATED tOPICS ABOUT MONITORING:
- Application Monitoring
- Understanding Persistent vs. Transient
- Changing Default Monitor Settings (RTX64 Control Panel)
- RTX64 Monitor
- Event Classes
